



For years, workforce data collection meant one thing: capturing when someone clocked in and out. That data was useful for payroll, but it rarely told managers anything about why attendance patterns looked the way they did, or what was coming next. In 2026, that’s changing. HR and operations teams across healthcare, manufacturing, and construction are moving past simple attendance logs and toward AI-powered analytics that turn raw punch data into decisions they can actually act on.
This shift isn’t about replacing HR judgment with algorithms. It’s about giving people managers a clearer view of what’s happening across shifts, sites, and teams, so the decisions they were already making get easier and faster to make well.
From Data Collection to Data Intelligence
Most workforce management systems have always logged attendance, leave, and overtime. The problem was never a lack of data, it was a lack of time to interpret it. A payroll administrator juggling multiple locations doesn’t have the bandwidth to manually cross-reference attendance trends with overtime costs and turnover risk every week.
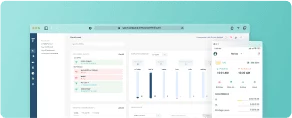
AI-powered analytics changes the equation by doing that correlation work automatically. Instead of a spreadsheet full of punch times, managers get a dashboard that flags where overtime is concentrated, which shifts are chronically understaffed, and which departments show early signs of disengagement. The underlying data hasn’t changed. What’s changed is how quickly it becomes something a manager can use.
Spotting Patterns Before They Become Problems
The real value of analytics shows up in what it catches early. A gradual rise in late arrivals on a particular shift might look like noise in a weekly report, but tracked over time, it can signal a scheduling conflict, a transportation issue, or a supervisor problem worth investigating. Similarly, a spike in short-notice leave requests from one team can be an early warning sign for burnout or low morale, well before it shows up in exit interviews.
Overtime is another area where pattern recognition pays off quickly. Occasional overtime is normal, but overtime that consistently concentrates on the same handful of employees or the same shift points to a structural staffing gap rather than a one-off surge in demand. Catching that early means it can be addressed through smarter scheduling rather than a larger payroll surprise at month-end.
Industry-Specific Wins
The practical benefits look different depending on the industry. In healthcare, where shift coverage directly affects patient care, analytics can help staffing coordinators anticipate gaps caused by leave clustering or seasonal illness trends and adjust rosters proactively instead of scrambling for last-minute coverage. In manufacturing, where production lines depend on predictable headcount, attendance and productivity data together can highlight which shifts or lines are most exposed to absenteeism risk. In construction, where crews move across multiple sites and contractors are common, analytics can surface attendance and compliance patterns across projects that would be nearly impossible to track manually.
Across all three industries, the common thread is visibility. Managers aren’t necessarily working with more data than before, they’re finally able to see it in a form that supports a decision rather than just documenting what already happened.
Getting Started Without Overhauling Everything
Adopting analytics doesn’t require ripping out existing systems or retraining an entire HR team overnight. The most practical starting point is making sure attendance, leave, and payroll data are already flowing into one connected system, since fragmented data across spreadsheets and standalone tools is the biggest barrier to useful analytics. From there, teams can start with a small set of metrics that matter most to their operation, such as overtime concentration or absence trends by shift, and expand as they get comfortable acting on what the data shows them.
The goal isn’t a dashboard for its own sake. It’s fewer surprises, faster staffing decisions, and a clearer picture of where workforce costs and risks are actually coming from.
Bringing It Together with Tempus Central
If your team is still piecing together attendance, leave, and payroll data from separate spreadsheets, it’s worth asking how much time that’s costing you every week, and how many early warning signs are getting missed along the way. Tempus Central’s platform, including the AI-powered analytics in Tempus a.EYE, is built to bring that data together so HR and workforce management teams can spend less time compiling reports and more time acting on what those reports actually mean. If you’d like to see what that looks like for your organization, our team is happy to walk you through it.